How to create first pipeline
What is Pipeline?
This document will guide you to get started and get hands-on with the pipeline dataset. In this document, we will see how to create a pipeline using a sample dataset.
Prerequisites
Existing (.ds) Datasets having at least 1 matching column.
Database tables have at least 1 matching column.
With Initial release, the user can join only datasets that are created JDBC source
Download Pipeline.zip file from the link given PipelineDataset.zip
1. Create Pipeline with Existing Datasets
To create a pipeline with Existing datasets, you should have at least 2 datasets with at least 1 matching column.
Here, to demonstrate how to create a pipeline, we are taking 2 sample datasets;
Customers. ds, which has information of customer details
Offices. ds, which has information on Office data
Here, both datasets have matching data in the Country, City, and State columns. We will create a pipeline dataset to get matching information from both tables using the inner join on the country column.
By Joining both tables with country, it will give us only matching data between 2 tables.
To know more about SQL joins, Follow this link SQL Joins
Let's get started with pipeline creation;
log in to the AIV application with valid user credentials
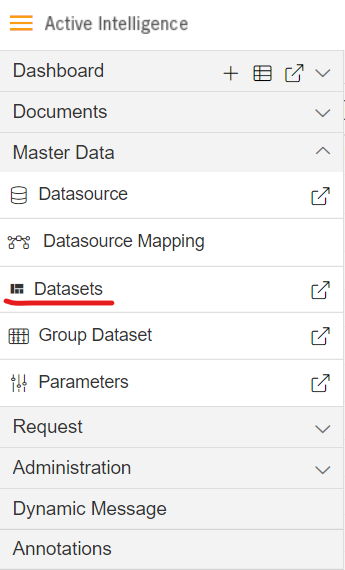
Go to Master Data > Dataset section from the Hamburger menu
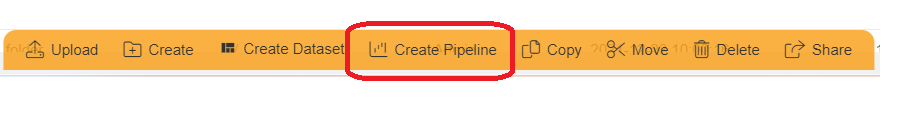
From the footer menu, click on create pipeline button to create a new pipeline
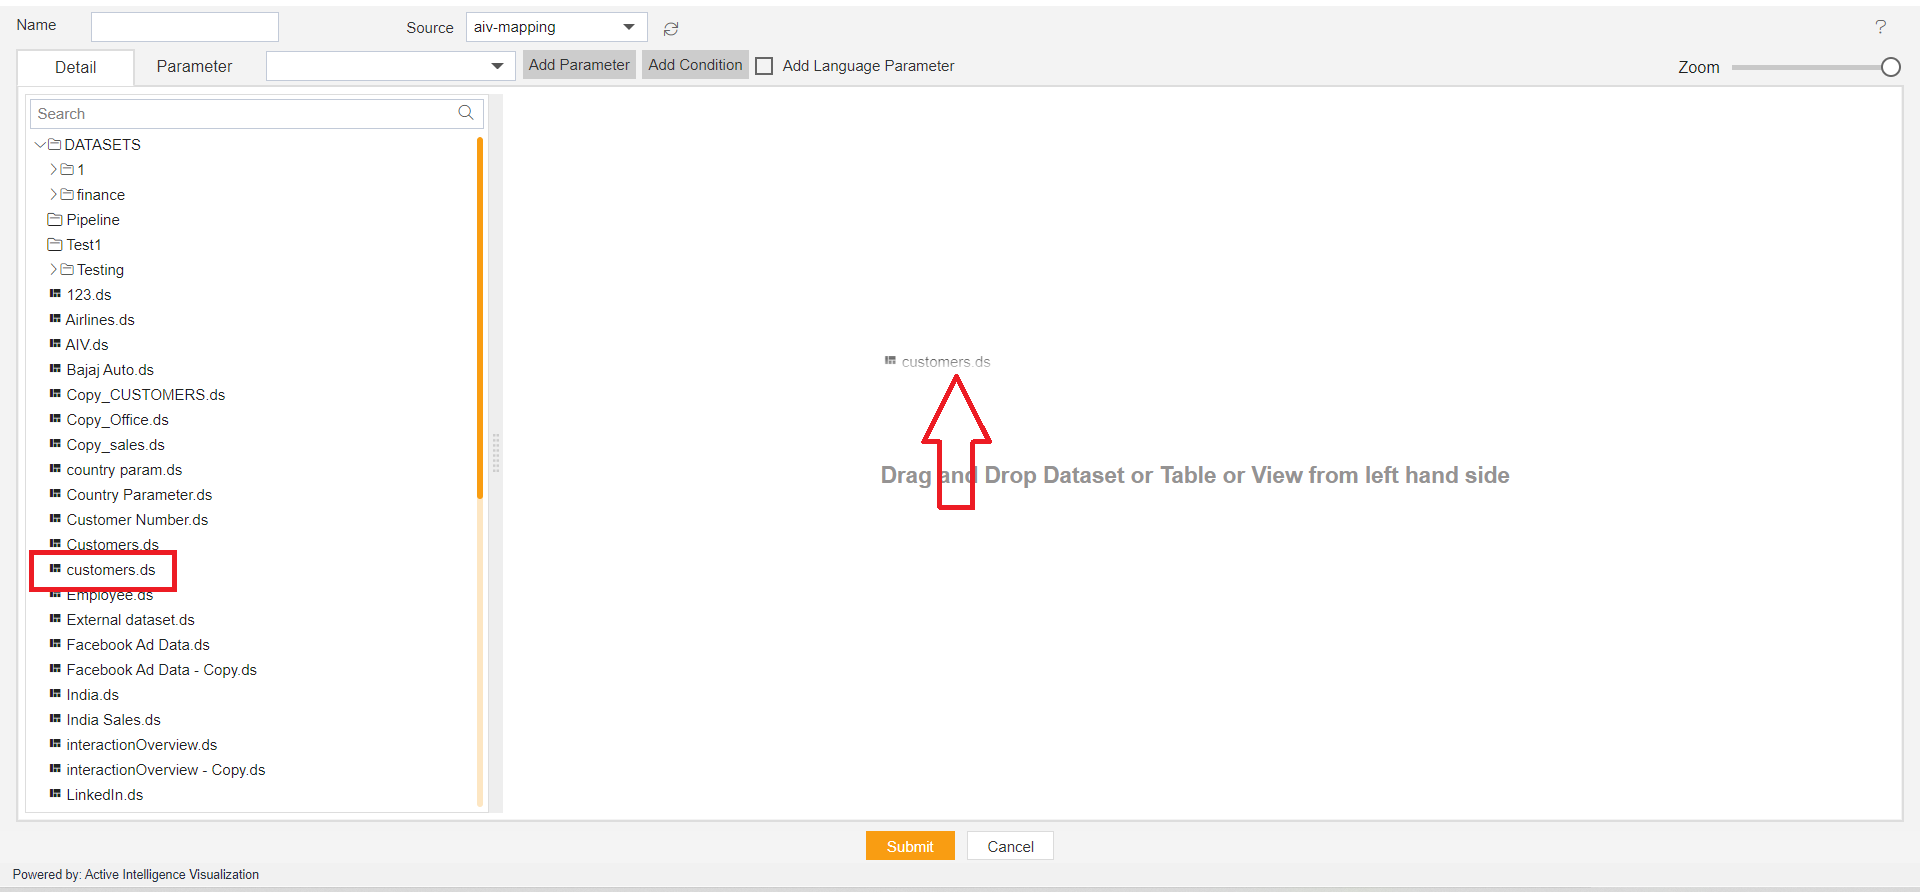
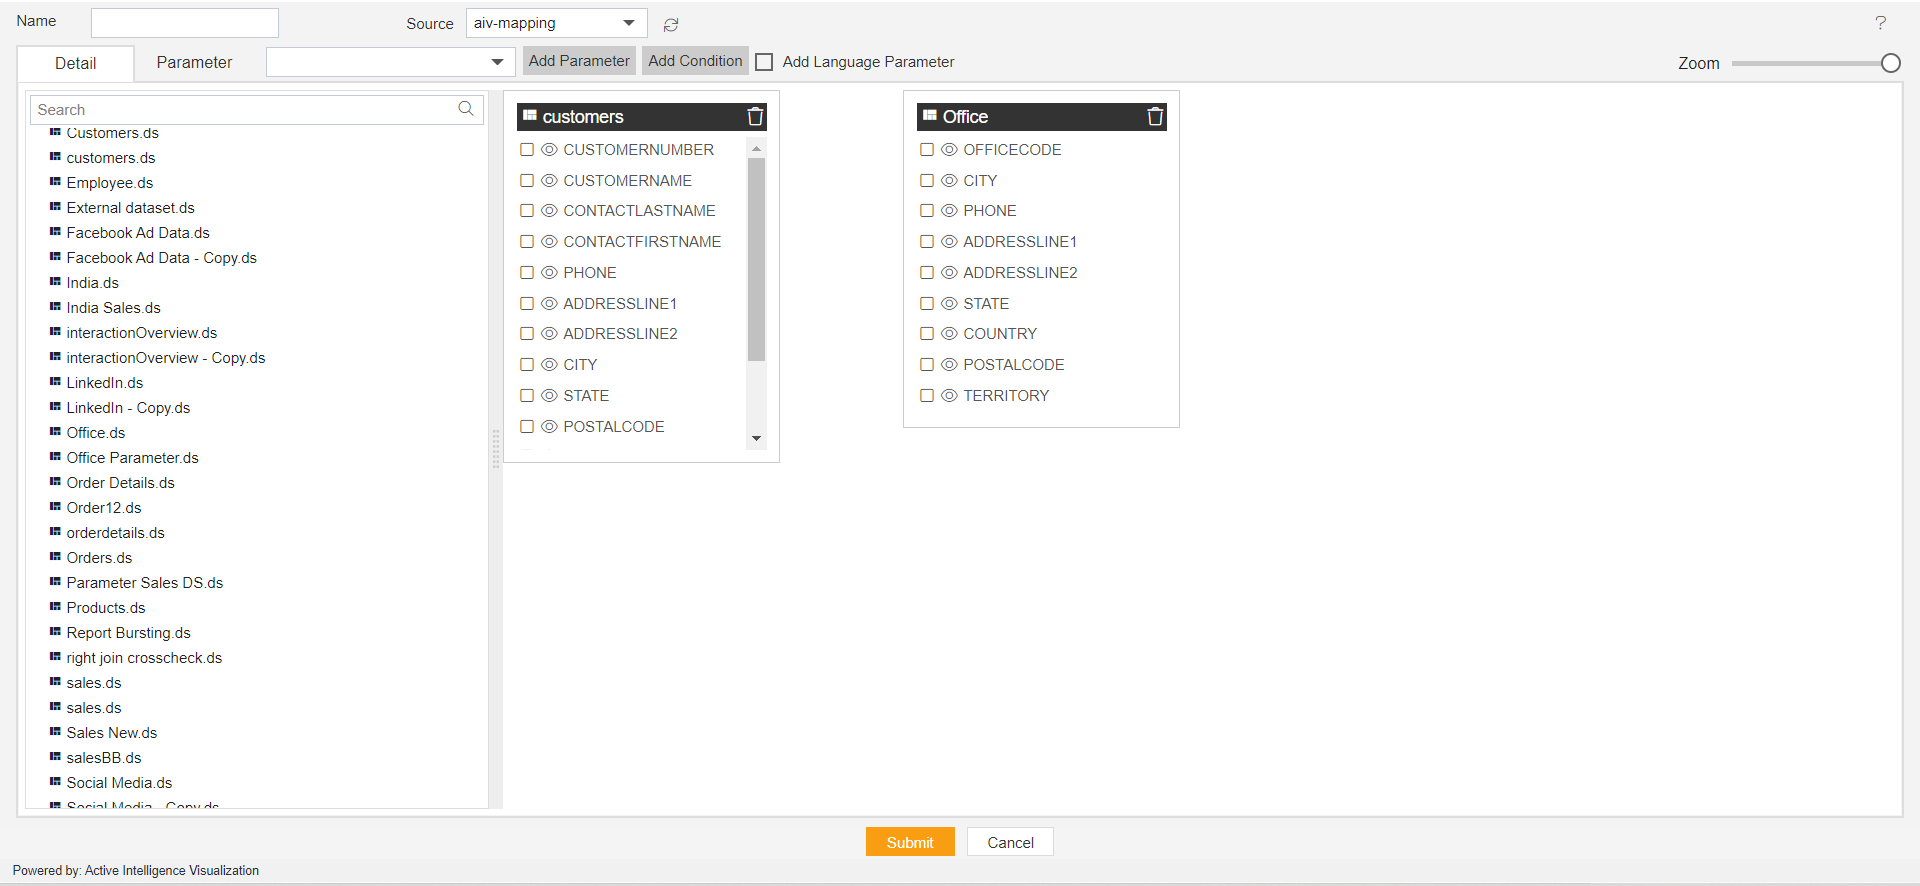
Once you click, you can see a blank create pipeline window as in the below image,
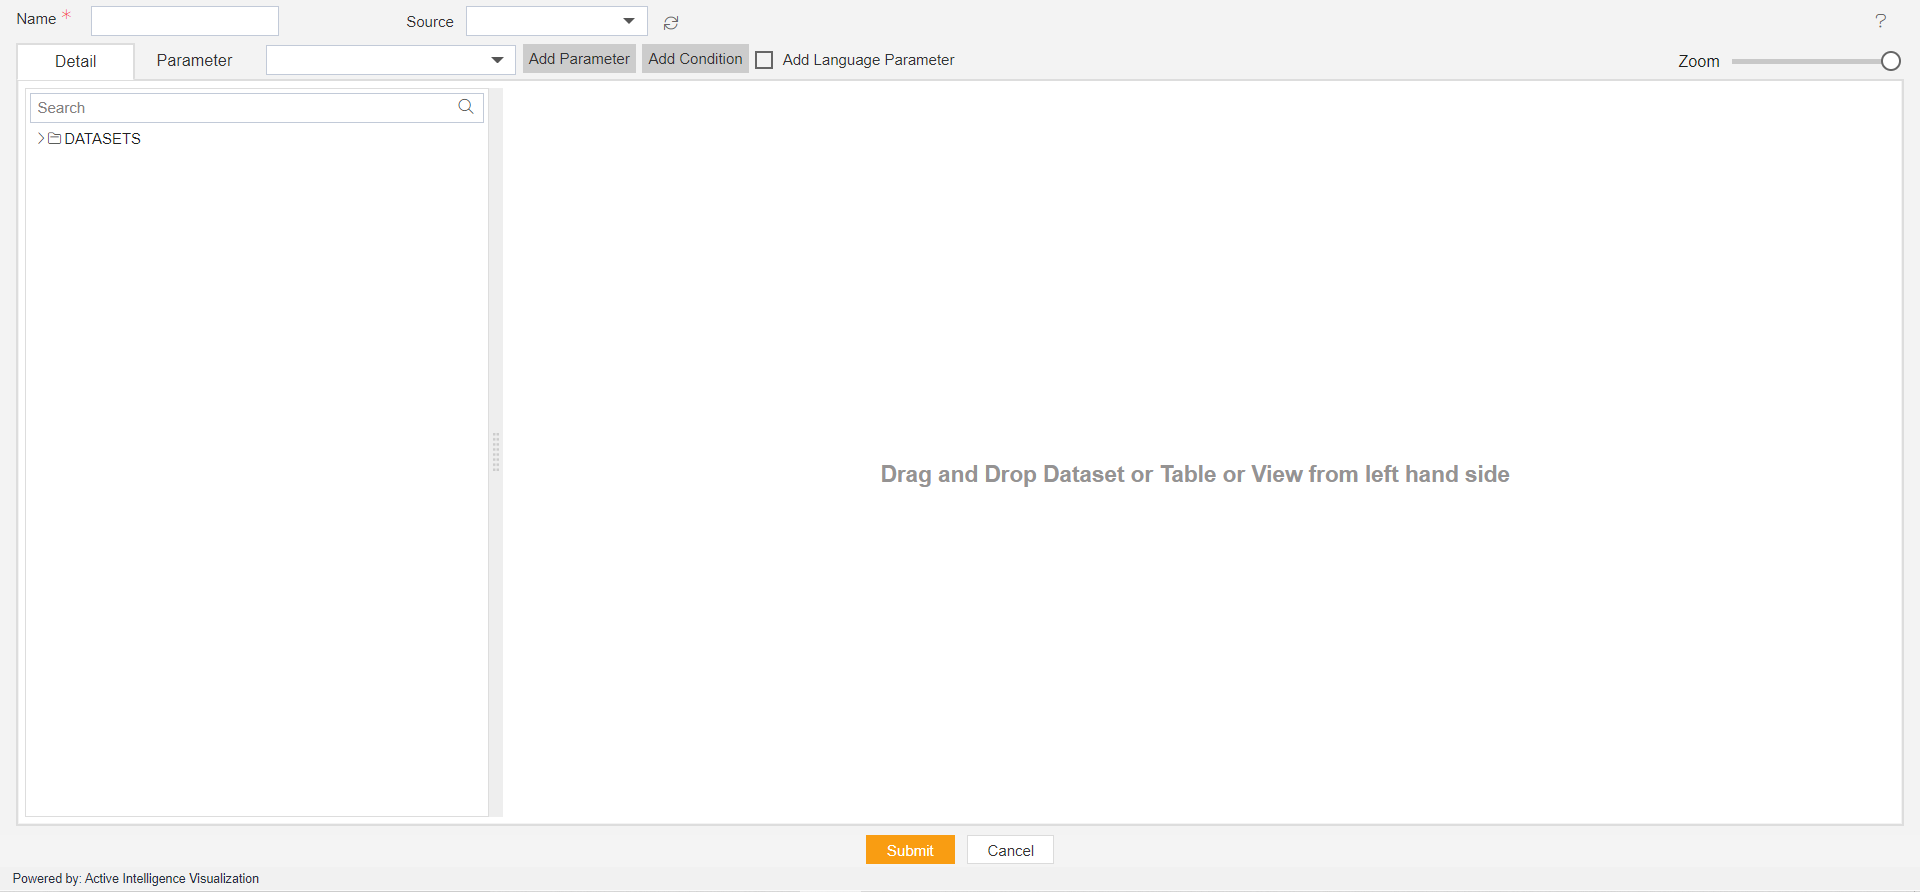
If you want to know the terminology of this window, please click here
You can see in Source: By clicking on this Source drop-down, you can see a list of data sources available for logged-in users. Users can select data sources to get the list of tables & views from that data source. First, we required a customer's table so we will search for the customer's dataset using the search box and drag and drop this dataset from list to playground.
Once you drop the dataset, a list of the columns will be displayed for that selected dataset.
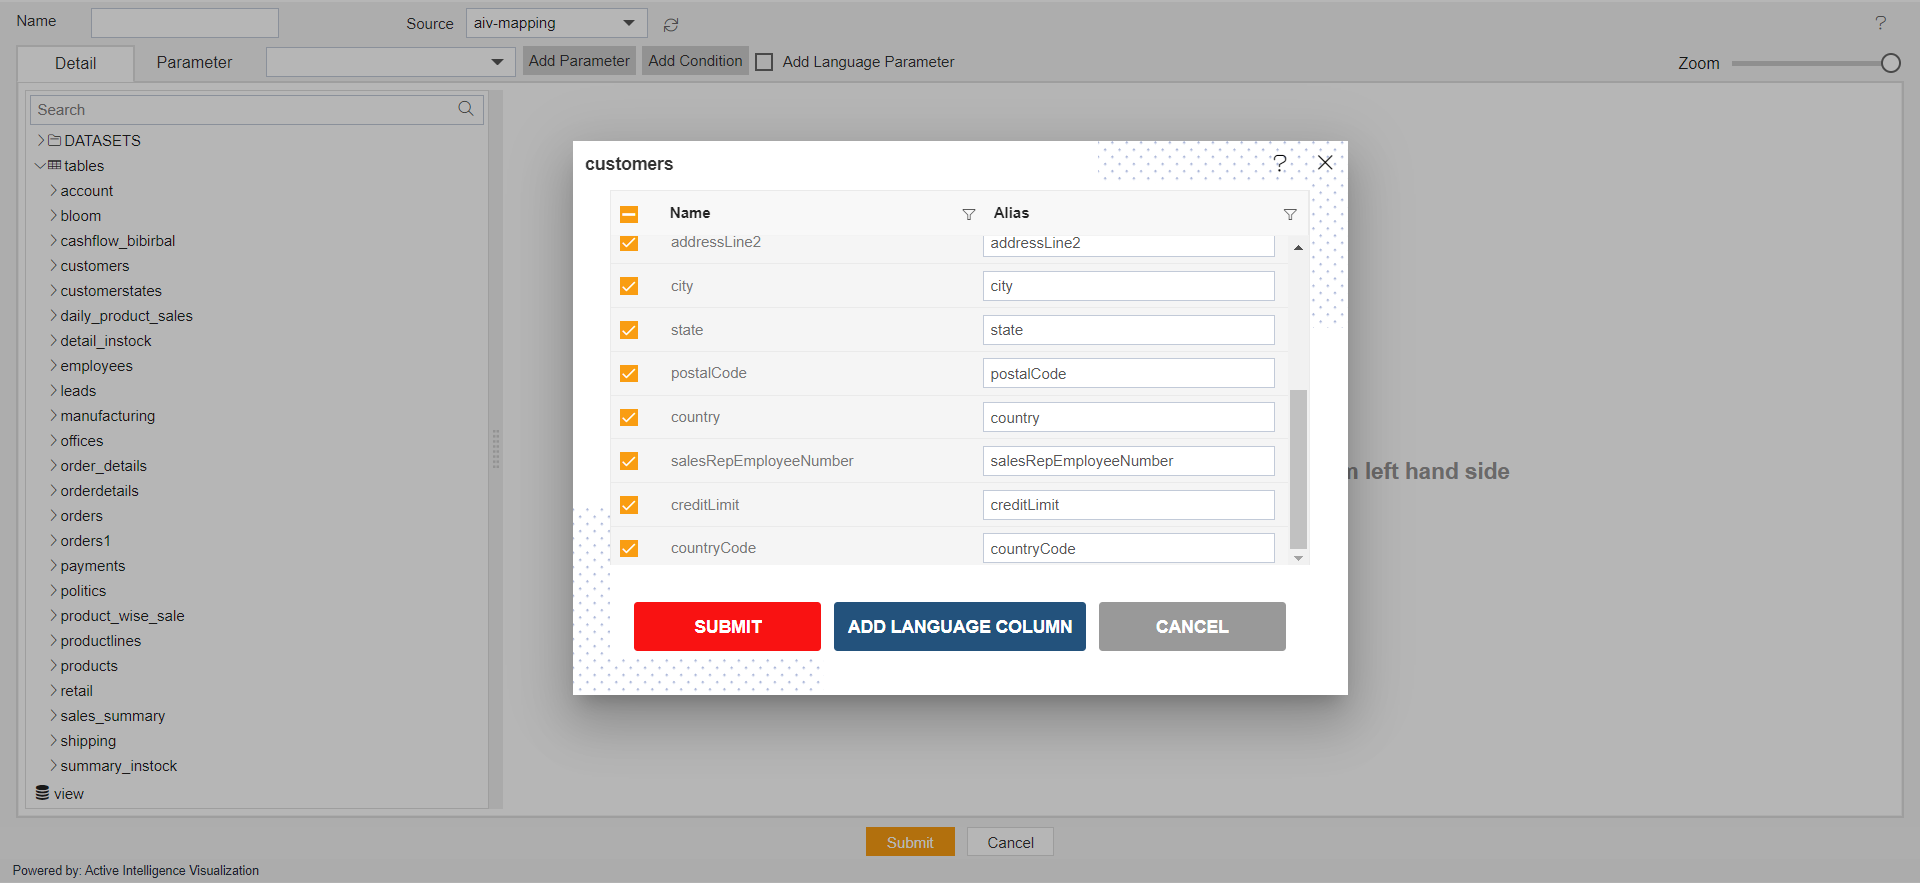
Here users can select or de-select columns to be added to the playground with a checkbox provided with each column name. By default, all columns will be selected.
You can see 3 buttons in this window,
Submit: After selecting/De-selecting required columns, click on submit to add this dataset to the playground. you can notice that only selected columns are added to the playground.
Add Language Column
This feature will not work with the initial release, it will be added in future releases
- Cancel: If you want to cancel this dataset to be added to the playground, click on the cancel button.
Column filter
In this dataset window, you can find and filter column using the filter option available at just the right side of Name Header
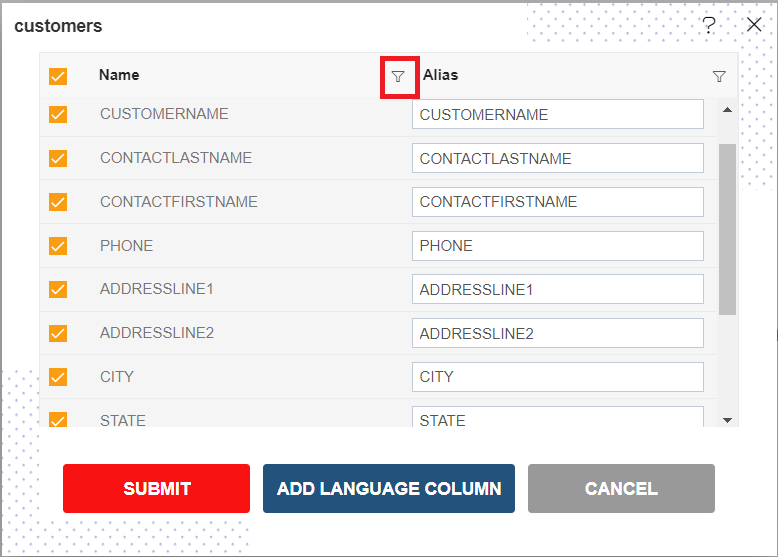
When you click on this filter options as below screen;
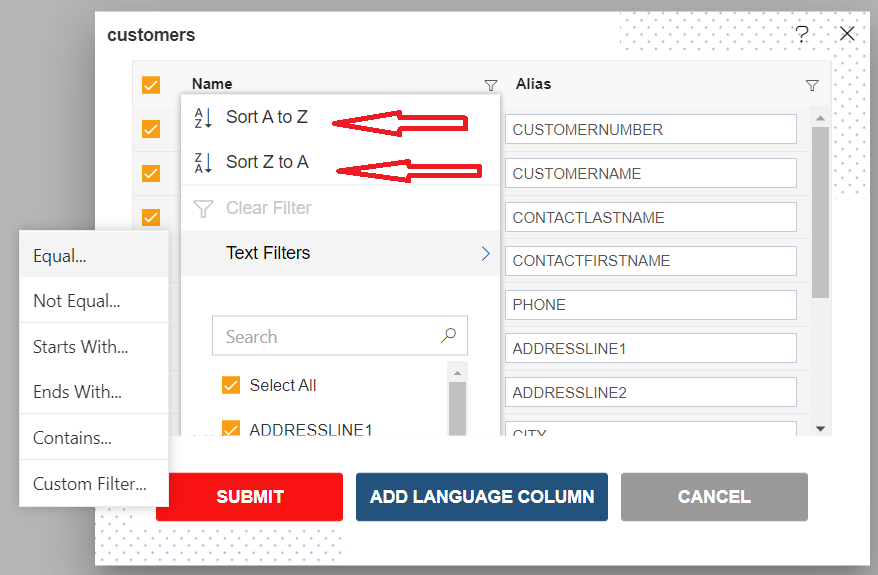
- You can sort the listing of columns with
Sort A to ZandSort Z to Aoptions
Text Filters
- There are many options available to filter columns listed below;
- Equal
- Not Equal
- Starts With
- Ends With
- Contains
- Custom Filter
In order to know more about how to use Text filters, Click Here
Column filters function in the same way for remaining columns like Alias and language columns if added.
Alias
Users can change alias datasets or table columns using an alias. The alias should be useful in the case where the user wants to show a different column name in GUI rather than what name coming from the database. This might be required in case Business users do not concern about naming conventions used by the development process they want Different names to display.
It is just like Mobile Phones having a different name for development firm and has different name while it is available in the market.
We can change the alias of the column just before adding the node to the playground as well as it is added to the playground.
TO know more about how alias can be applied, Click here
Once a node of the customers dataset is added in the playground, we need to add a second node of the offices dataset.
2. Add a second node into a playground
Use Case: Suppose the user requires to get the total credit limit of each Sales Employee Territory wise. but if you look into the customer's table, there is no Territory column data available but only has Employee record in salesRepEmployeeNumber column and credit limit in credit limit column. But we have Another table named Offices which has Territory data. So to get Territory data, we can use this table on one condition, there has to be at least one matching field between these 2 tables then only we can join these tables on the matching column and get the data based on the joining condition.
Now both these nodes are having matching data in the country column and both nodes have the country column in them.
To get matching data from both the tables, we have to join both tables with matching columns and that is country in this case.
Refer Steps we have followed to add customers node into the playground to search and add offices node in the playground.
Once offices node is added, you will see 2 nodes in the playground as in the below image,
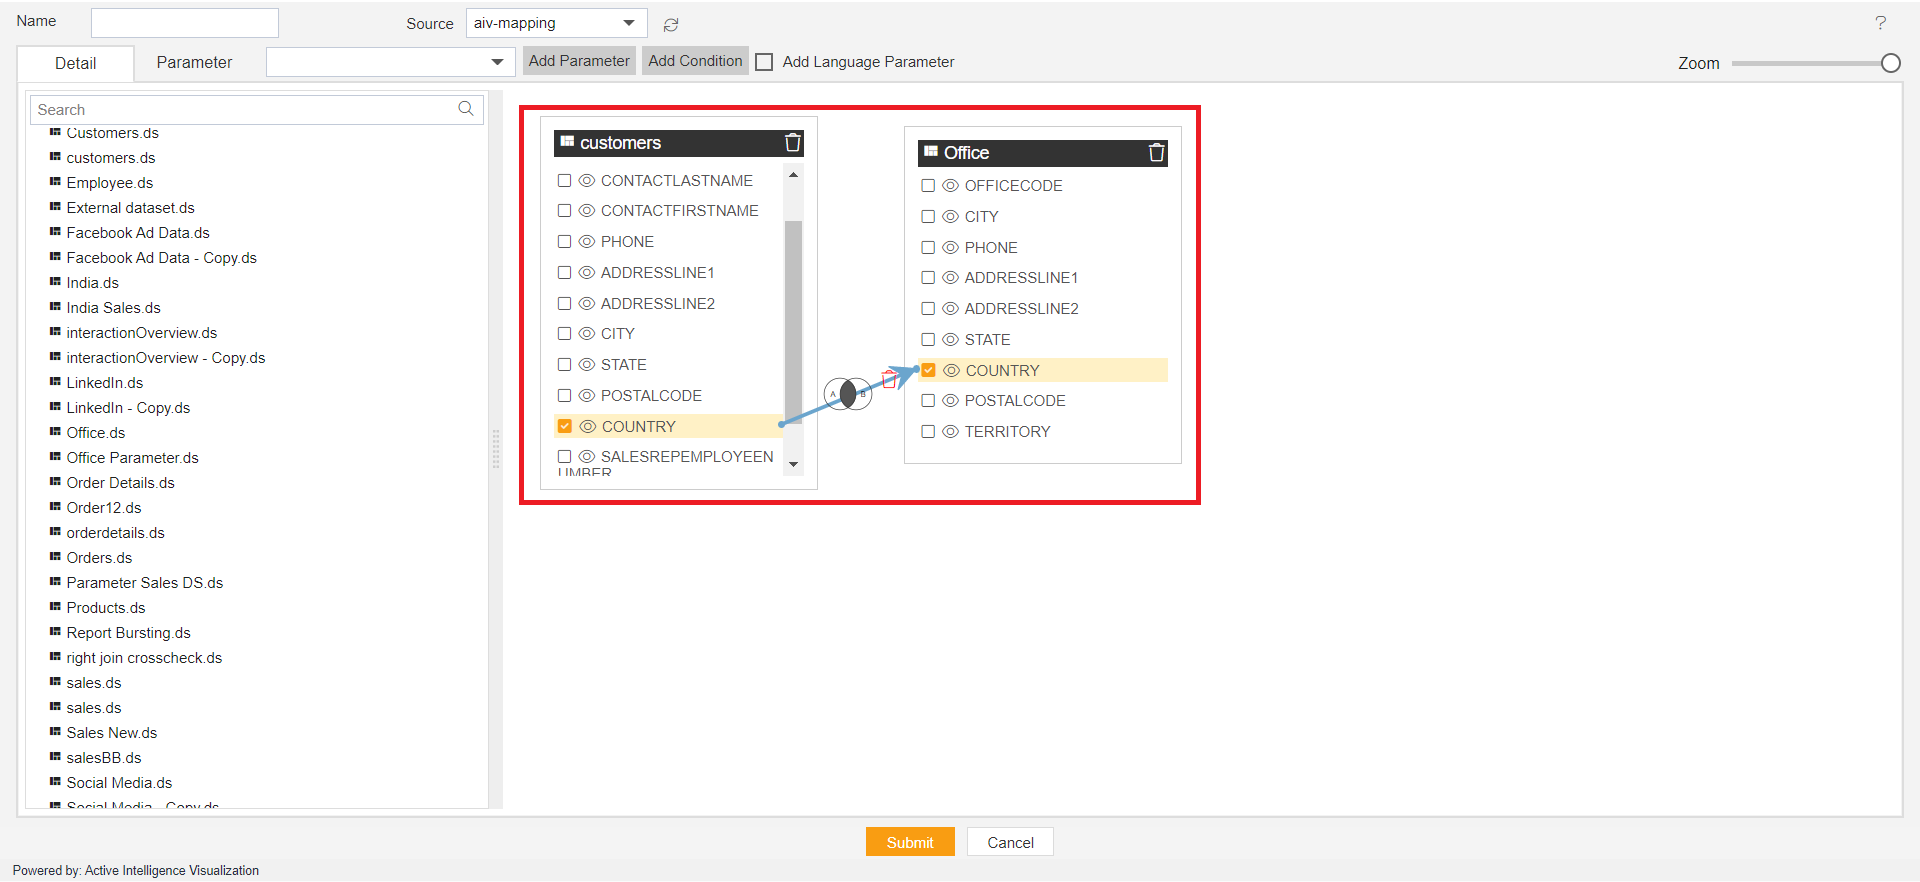
To make the join between tables, it is very simple with the pipeline. hover your mouse pointer on the country column of the customer's table and press the left click of the mouse and drag your cursor on a country column of the second node which is offices and drop it on this column name. You can see an arrow appears between his 2 columns and the selected column is highlighted as shown in the below image,
Once join is created you can see the Checkbox of both the columns are selected and a small diagram will be displayed at the middle of the arrow and a delete icon as well.
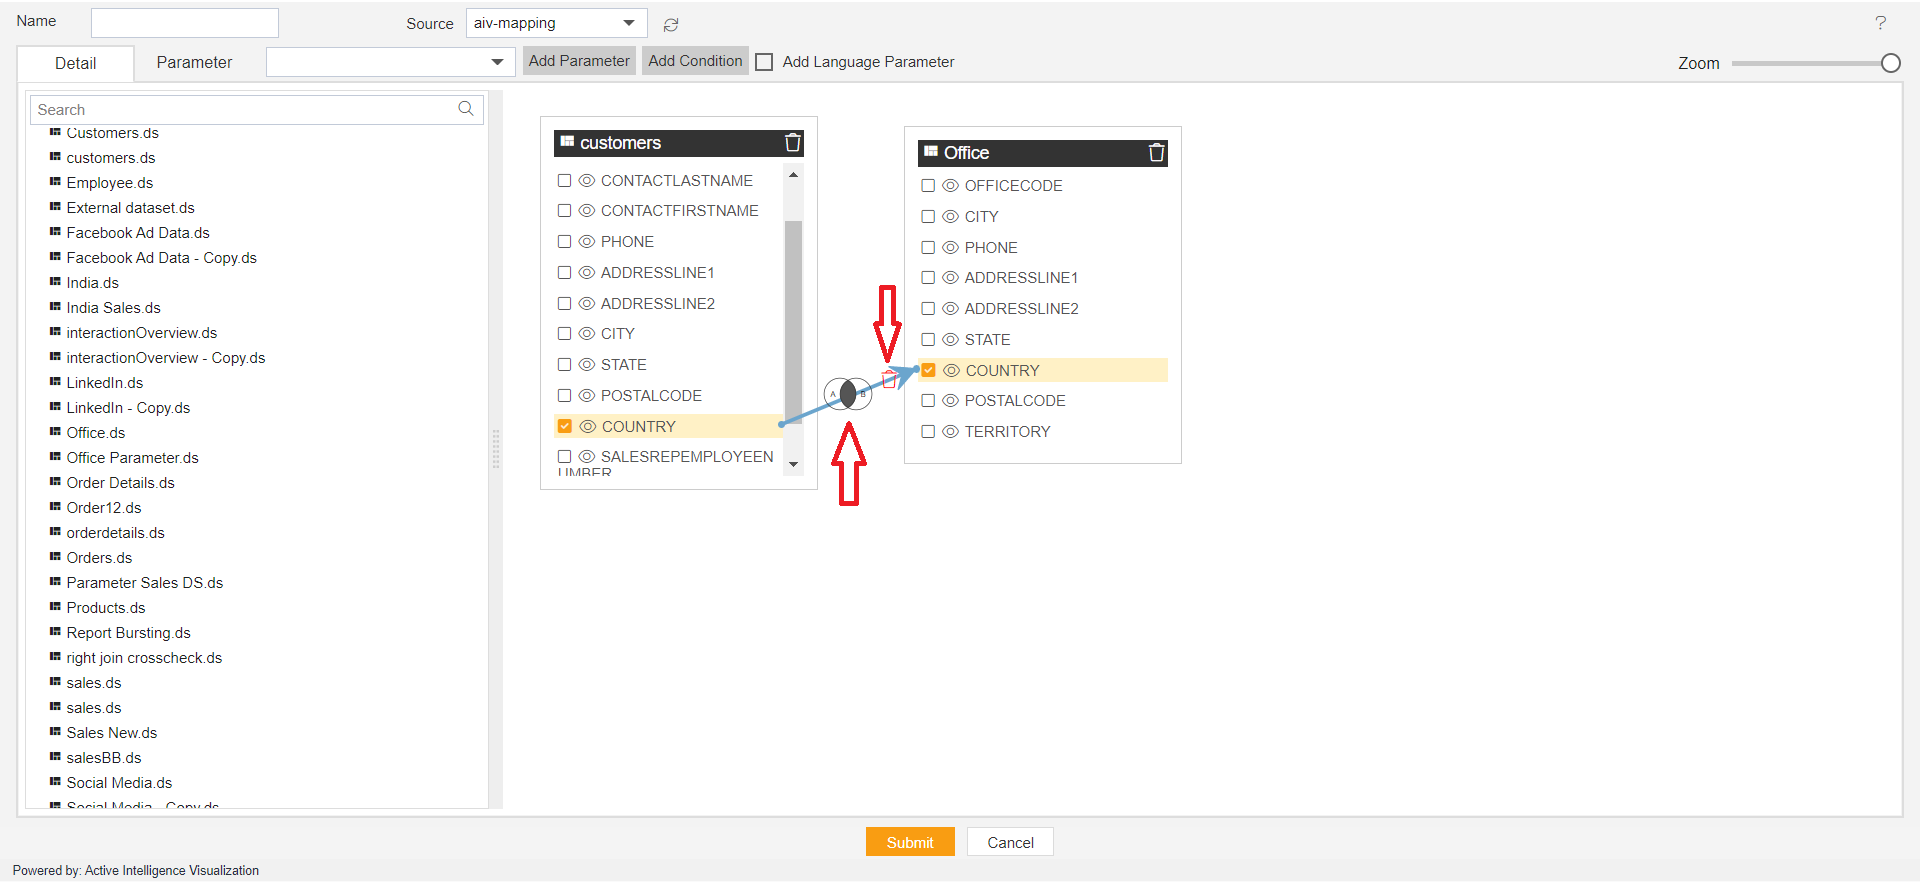
- Here Small diagram called
Venn Diagrmdisplayed on arrow line represents Type of join applied between 2 nodes. - And Delete icon At the arrowhead side is used to delete the link between nodes.
Type of Join
Once the link is created between nodes, by looking at Venn Diagram we can have an idea of which kind of join is applied between 2 nodes.
To know more about different kinds of joins, click here
By default, the join type is an inner join.
To change the join condition, click on this Venn diagram and you will see Pipeline configuration window will be open,
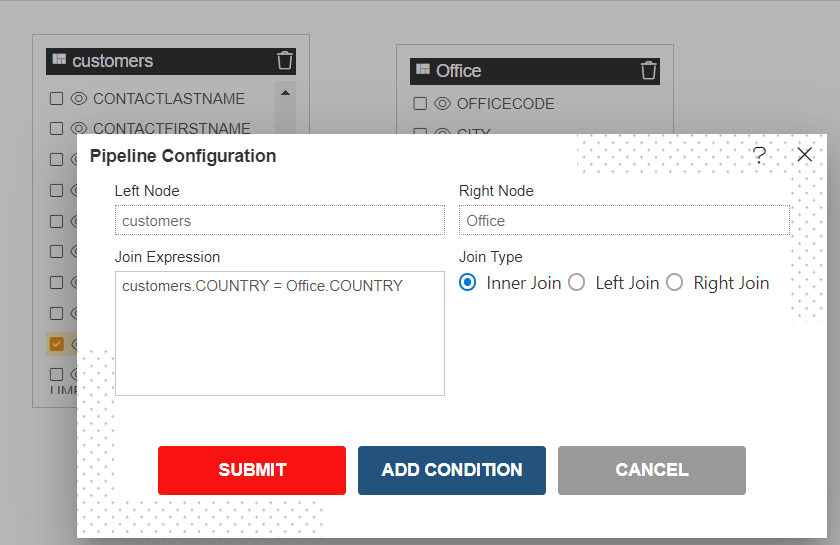
Pipeline Configuration
To know operations performed in this window, Click Here
Click on Submit button and Give the name of the pipeline.
Name: Customers
Click on Submit button to create a pipeline.
The pipeline is run in the Adhoc Analysis.
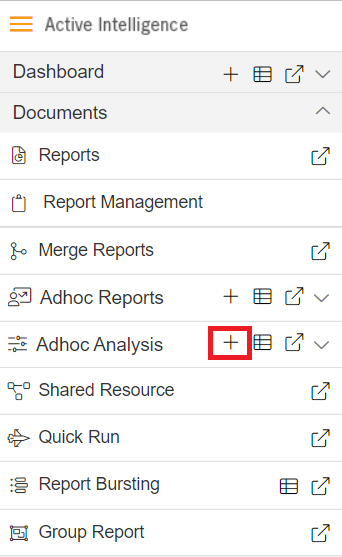
Go to Documents > Adhoc Analysis section from the Hamburger menu.
In Adhoc Analysis click on the + icon to create a new Analysis, as shown in the figure below:
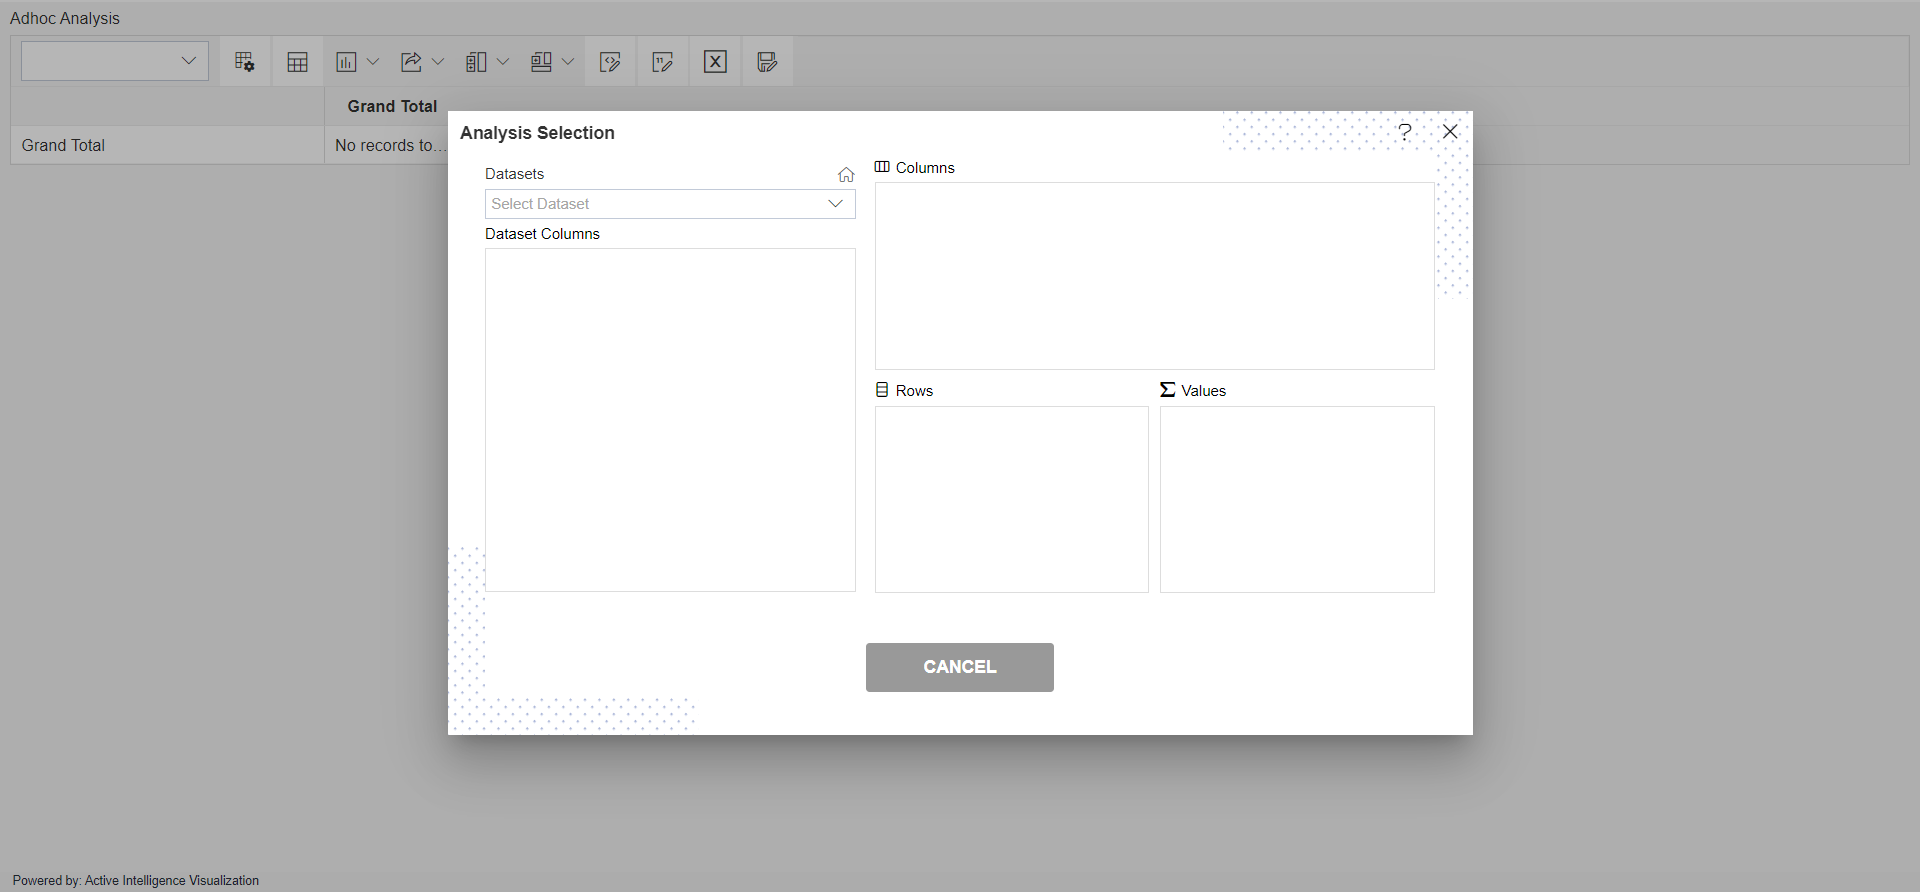
When you click on create Analysis then the Analysis Selection dialog box will open, as shown in the figure below:
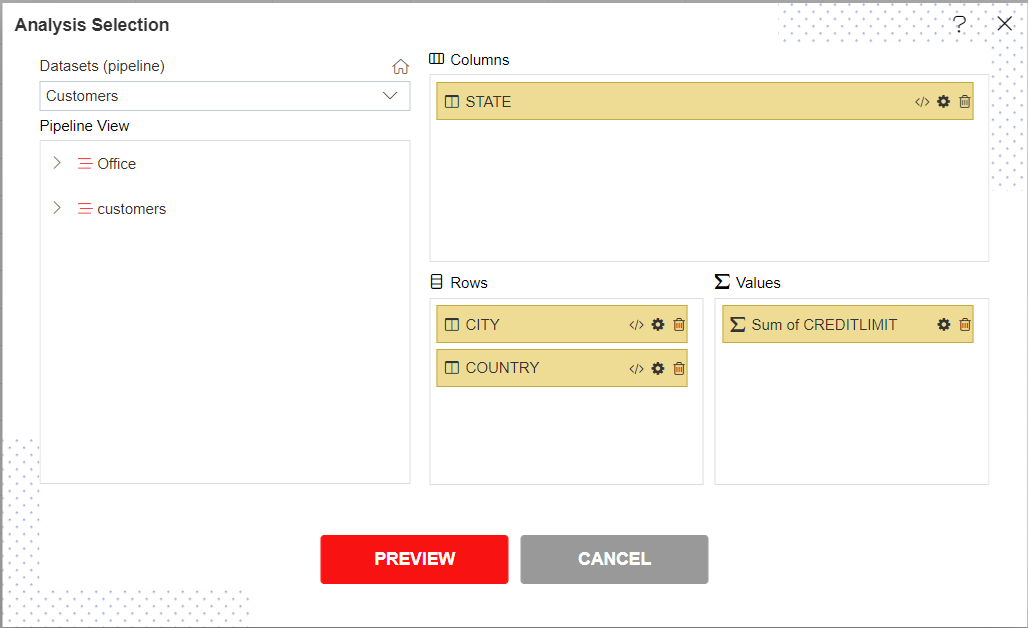
Enter the following details in Analysis Section:
Dataset: Customers (select the Pipeline, which you are created)
The two tables will get load the left side box of Pipeline view, Now expends the OFFICES table.
Drag and drop City, Country in Rows Box from the Office table and State in Column box and Creditlimit in Values Box from the Customers table, as shown in the figure below:
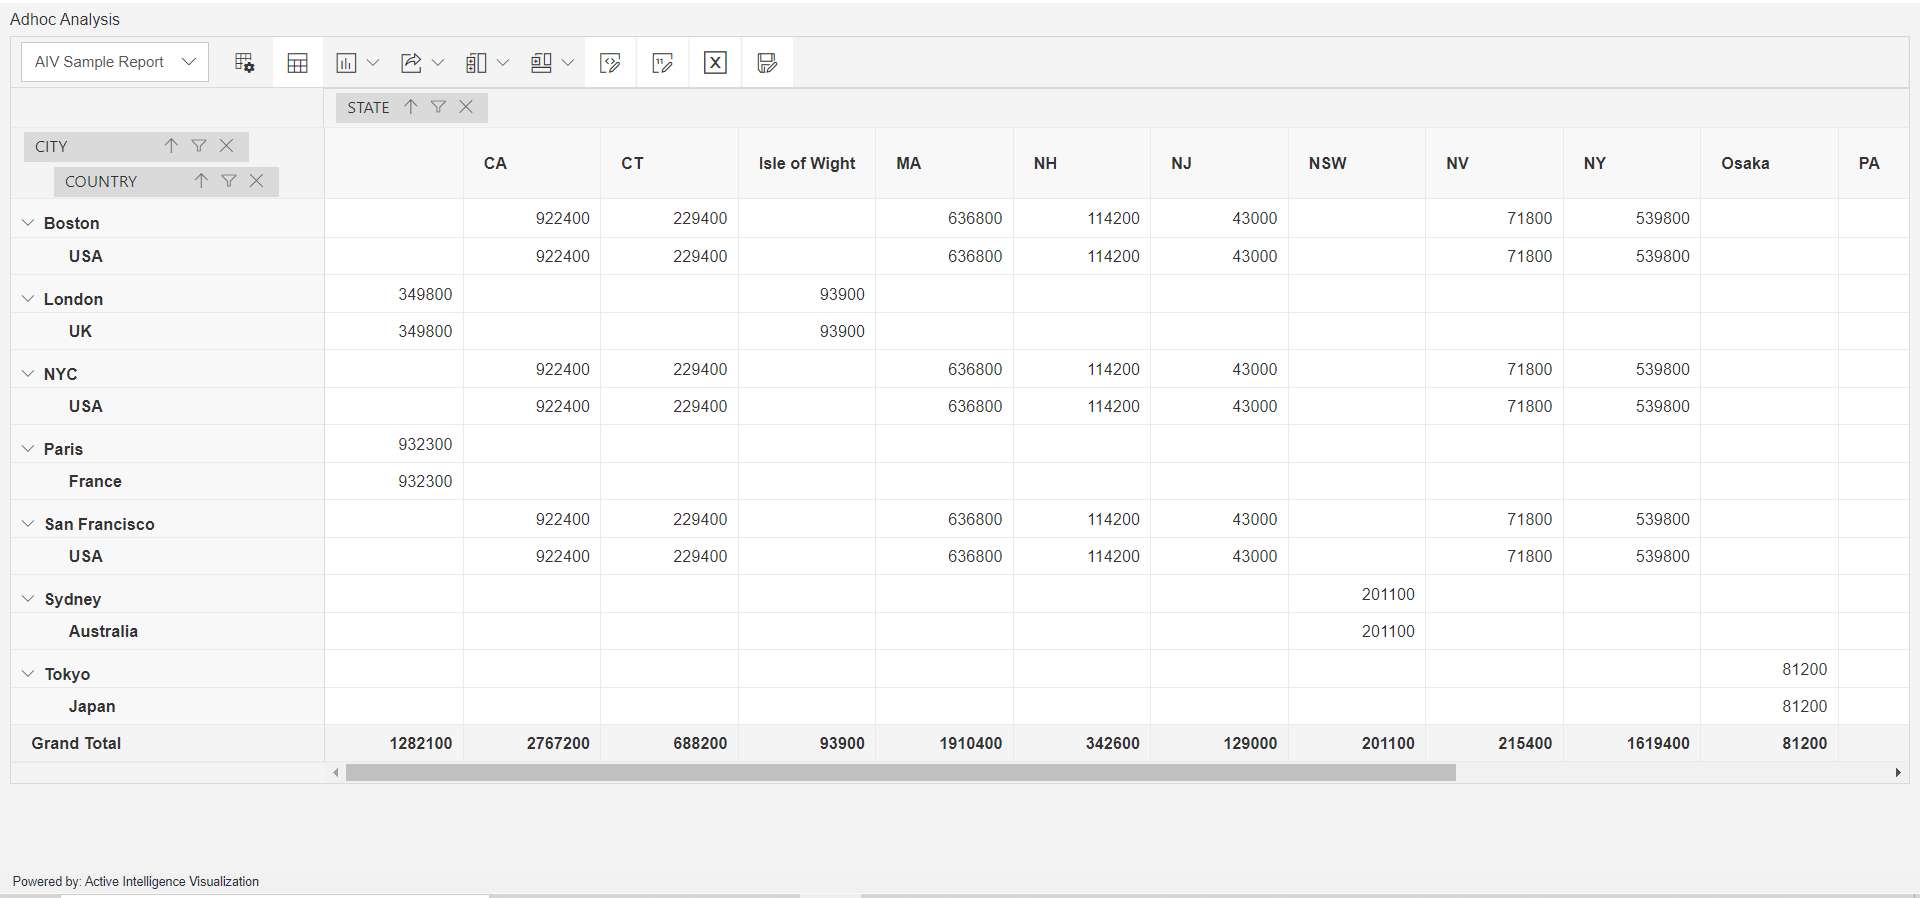
Click on Preview Button it will show the output and after the preview click on Cancel Button it will show the screen as follows:
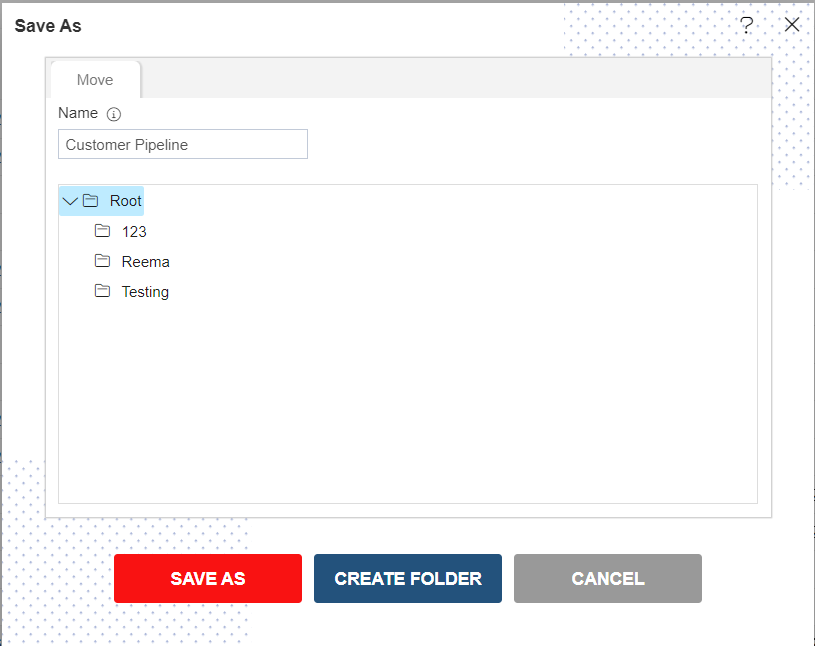
Click on Save as![]() icon for saving the Analysis, it will show the screen as below:
icon for saving the Analysis, it will show the screen as below:
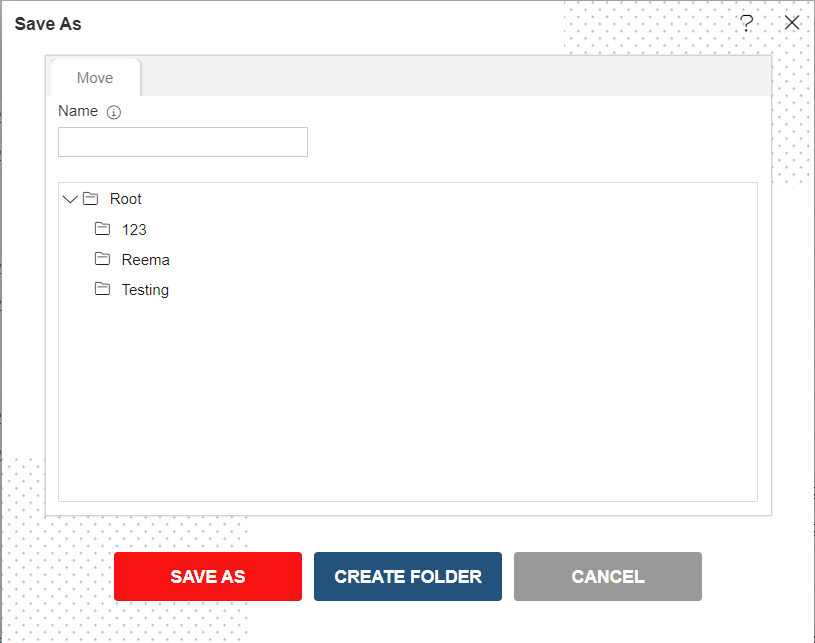
Give the name of Analysis.
Name: Customer Pipeline and Select the folder where you want to save Analysis, as shown in the figure below: