Chart Tooltip
Chart Tooltip: This video contains how to use chart tooltip in AIV.
tip
Only users with Dashboard privilege have access to this section!
Read 5 minutes tutorial here.
The chart tooltip is used to set the tool tip in the chart, the tooltip used to display the value of X-Axis and Y-Axis in the chart.
By default, it stays enabled and if the user wants to disable the tooltip option, control menu will appear as shown in figure below:

As you can see in the below figure, the chart displays the value and category data by default:
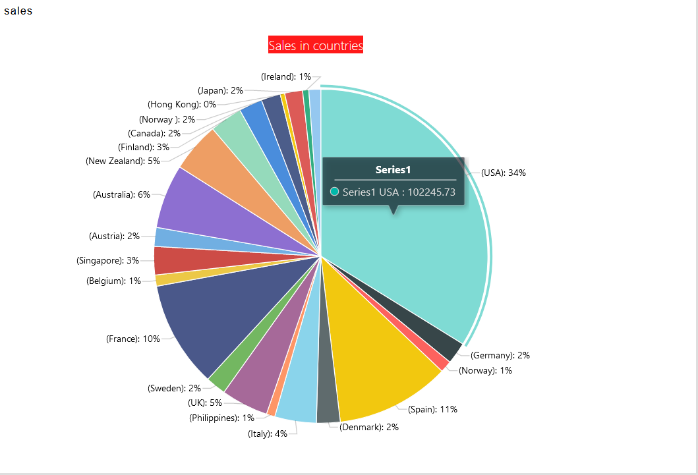
In the tooltip text, the default series name used to display series name and Point X & Point Y displays the X-Axis value and Y-Axis value in chart.

✒️ To know more about other formatting properties click on below links:-